Anomaly in Weather Model
Differences in available Weather models for historic temperature
projectsresearchphdenergyweather
542 Words
2023-11-27
For my PhD, I am using various different weather sources to create an energy system model which is used to model the behavior of the european energy market.
To be able to download and utilize weather data for a simulation, I crawled weather data for every NUTS area in Europe.
Current Source
For this, we were using Data from the Deutscher Wetterdienst which has reanalysed weather data on a granularity of 6km for all of Germany. This is available for free from here and includes the years 1995 to 2019.
Newer Data
For newer data, we are using the dataset from the ECMWF ERA5 reanalysis dataset. This in general works quite well, and in theory allows to create a model for different places all over the world too.
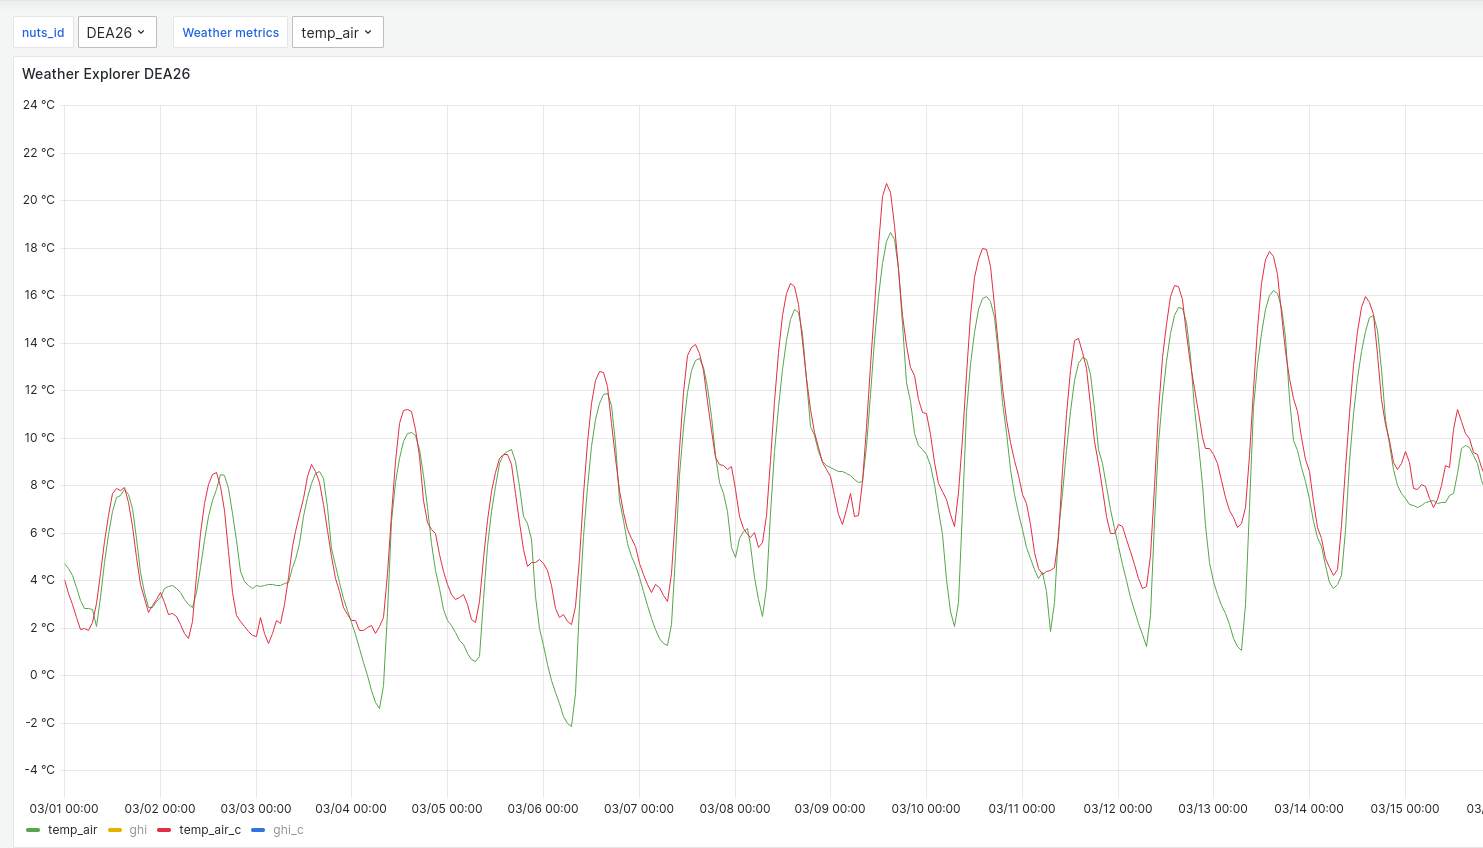
When I compared the datasets for some times I found huge temperature differences like this:

The temperature drops much steeper with the ECMWF model than with the Cosmo model in those nights. In some weeks, I can report differences of 9°C. And these are no forecasts but historic weather near to actual measurement locations.
But where do the differences come from? Which source is the more correct one? Is one of the models actually wrong?
Analysis
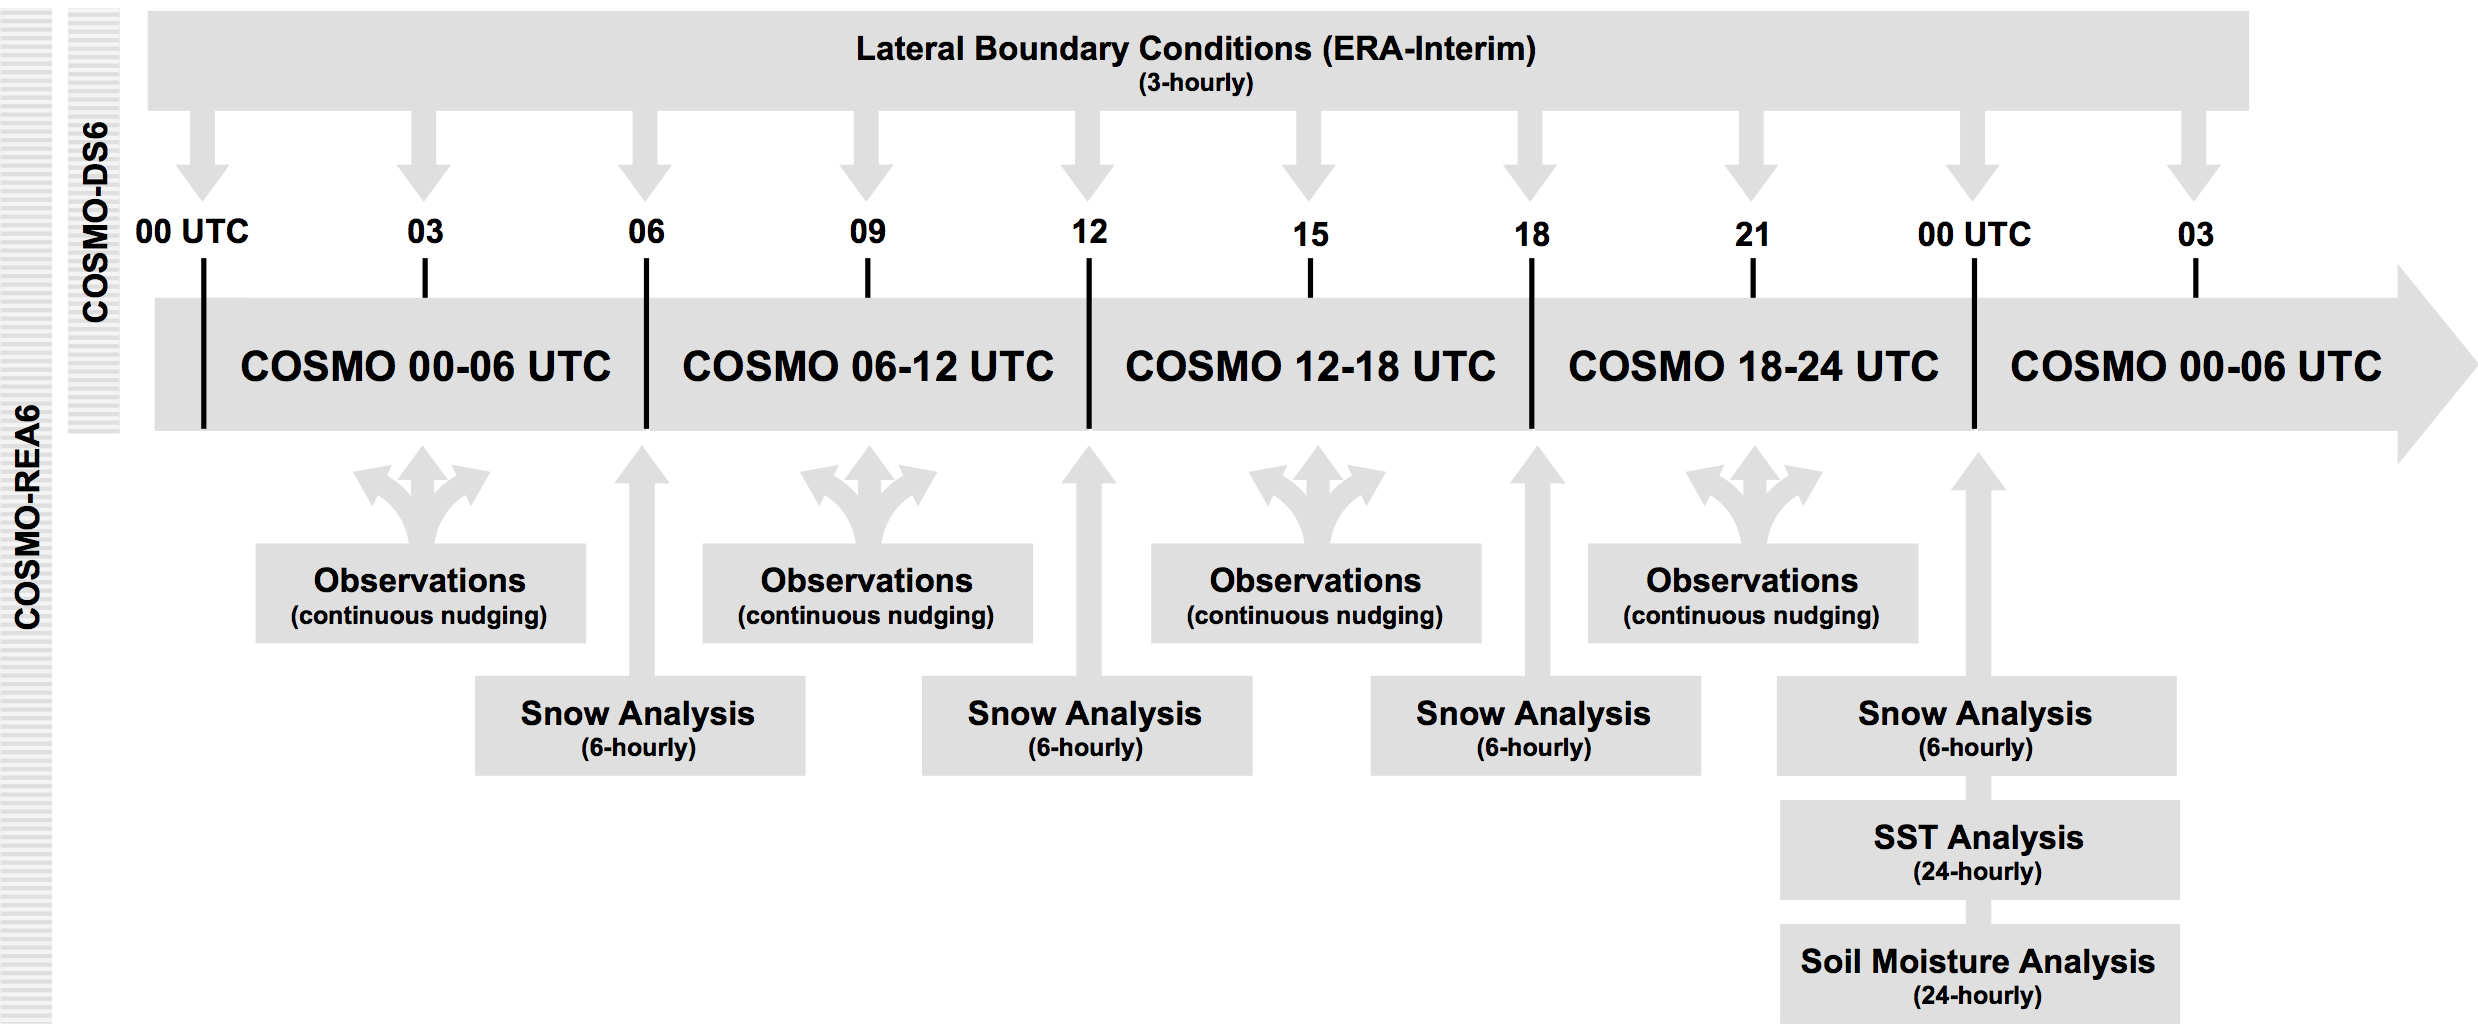
Looking at the weather models, I found a description of the DWD COSMO REA6 model here: https://reanalysis.meteo.uni-bonn.de/?COSMO-REA6
Which has a nice graphic

As I understand, the DWD model is based on the ECMWF ERA-interim model which is fine-tuned with more data from local weather stations. So it seems, that the DWD model is actually more accurate.
ECMWF models
The differences of the different ECMWF ERA5 models are described on this page: https://confluence.ecmwf.int/pages/viewpage.action?pageId=74764925
So it indeed looks like the ERA5-interim model is more like the base for both of these models and the ECMWF ERA5-land ist just not as accurate as the COSMO DWD REA6 model.
Eventually, the temperature of the ECMWF model might be actually fitting when looking at the temperature of 10M height. And DWD is more fitting for the 2M height as specified.
This would be unusual as both metrics are meant to provide the actual temperature in the height of 2M as their metrics are defined that way (DWD: T_2M/T_2M.2D vs ECMWF: 2m_temperature).
Third option
I am now considering to research a commercial weather model which I can use to put some light into this question and see which data they resemble more.
Eventually this clears things up and helps me to get a better understanding of weather models.
Closing Words
For my research I surely will use the ECMWF ERA5 model, as the DWD COSMO REA6 does not cover data more recent than the end of 2019. ECMWF on the other hand covers all places of the world with a granularity of 30km for 1940 to present - and is free of charge available under the open CC-BY 4.0 license.
Furthermore, the wind measurements are actually quite similar between the models, irradiation differs too, but in general those models provide not completely different results. And I am more than happy that meteorologists make these available.
And if you ever need a crawler to just download the whole of ecmwf for a given region into a local timescale database, I have you covered too: https://github.com/NOWUM/open-energy-data-server/blob/main/crawler/ecmwf.py