Monitoring of Proxmox with Ceph cluster
Using Influxdb to monitor ceph and Proxmox
projectsproxmoxcephinfluxdbmonitoringgrafana
775 Words
2025-04-27
While popular solutions include Prometheus as a database - we are using InfluxDB as this setup works with only having the InfluxDB instance publically available configure, while the agents (ceph and Proxmox nodes) are behind a firewall.
We are using Grafana for the visualizations of the monitoring. The Ceph Influx integration for ceph monitoring and the Proxmox InfluxDB metric server configuration for Proxmox cluster monitoring.
Docker compose
The following docker compose file is used:
services:
  grafana:
    image: grafana/grafana-oss:latest
    container_name: grafana
    restart: always
    ports:
      - 3000:3000
    volumes:
      - ./data/grafana:/var/lib/grafana


  influxdb:
    image: influxdb:1.11-alpine
    container_name: influxdb
    restart: always
    ports:
      - 8086:8086
    volumes:
      - ./data/influx:/var/lib/influxdb
    environment:
      - INFLUXDB_DB=monitor
#      - INFLUXDB_USER=telegraf
#      - INFLUXDB_ADMIN_ENABLED=true
      - INFLUXDB_HTTP_AUTH_ENABLED=true
      - INFLUXDB_ADMIN_USER=telegraf
      - INFLUXDB_ADMIN_PASSWORD=$INFLUXDB_PASSWORD
      - INFLUXDB_META_DIR=/var/lib/influxdb/meta2
If INFLUXDB_HTTP_AUTH_ENABLED is not set - it does not require any authentication, so make sure to have this set.
Additionally, we require to have a .env file which contains two random passwords with these keys:
INFLUXDB_PASSWORD=
INFLUX_USER_PASSWORD=
Grafana
Now we create a new user “monitor” with read-only access to the influx database for use in Grafana:
source .env
docker compose exec influxdb influx -username telegraf -password $INFLUXDB_PASSWORD -execute "CREATE USER monitor WITH PASSWORD $INFLUX_USER_PASSWORD"
docker compose exec influxdb influx -username telegraf -password $INFLUXDB_PASSWORD -execute 'GRANT READ ON "monitor" TO "monitor"'

# verify it worked:
docker compose exec influxdb influx -username telegraf -password $INFLUXDB_PASSWORD -execute "show users"
We add the InfluxDB datasource to Grafana using the readonly user, as Grafana should not have write access to the data sources.
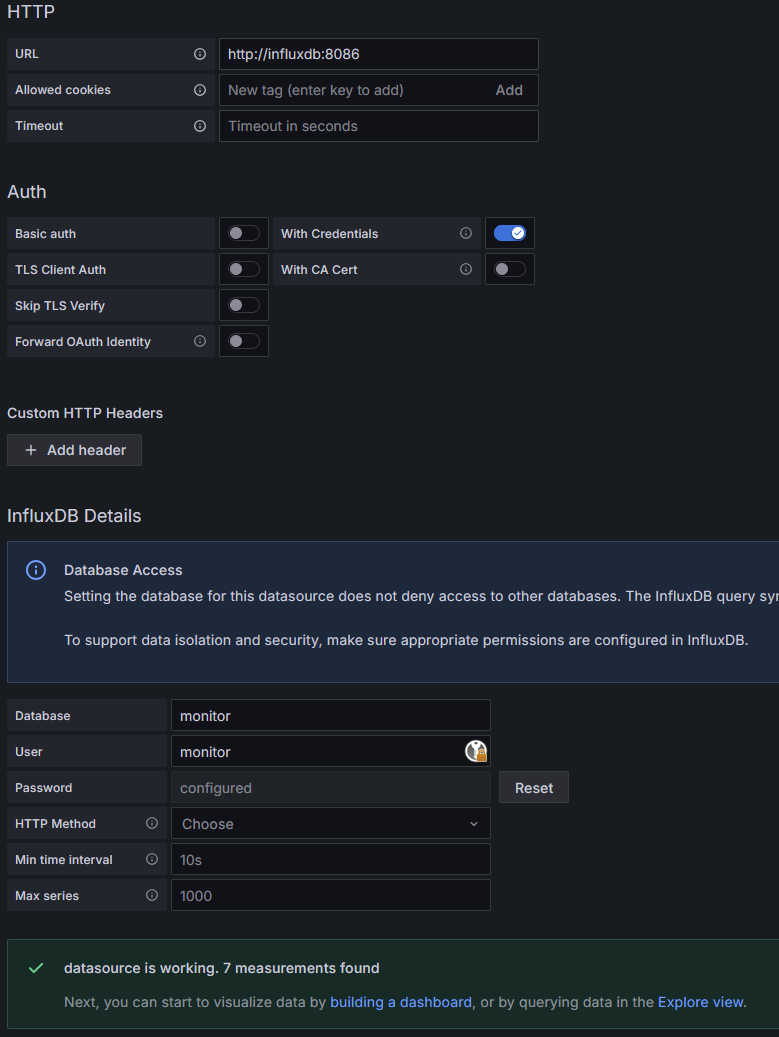
Setup of InfluxDB datasource in Grafana. The hostname can be InfluxDB as the container is available under its name in the same docker compose network.
Setup Proxmox Integration in Dashboard
Next up is the configuration of Proxmox to send the measured data into the InfluxDB. As the cluster has access to the internet (mainly for updates), but does not have access to the VM network, we have a public Nginx terminating TLS and doing the reverse proxy part for InfluxDB 1.x.
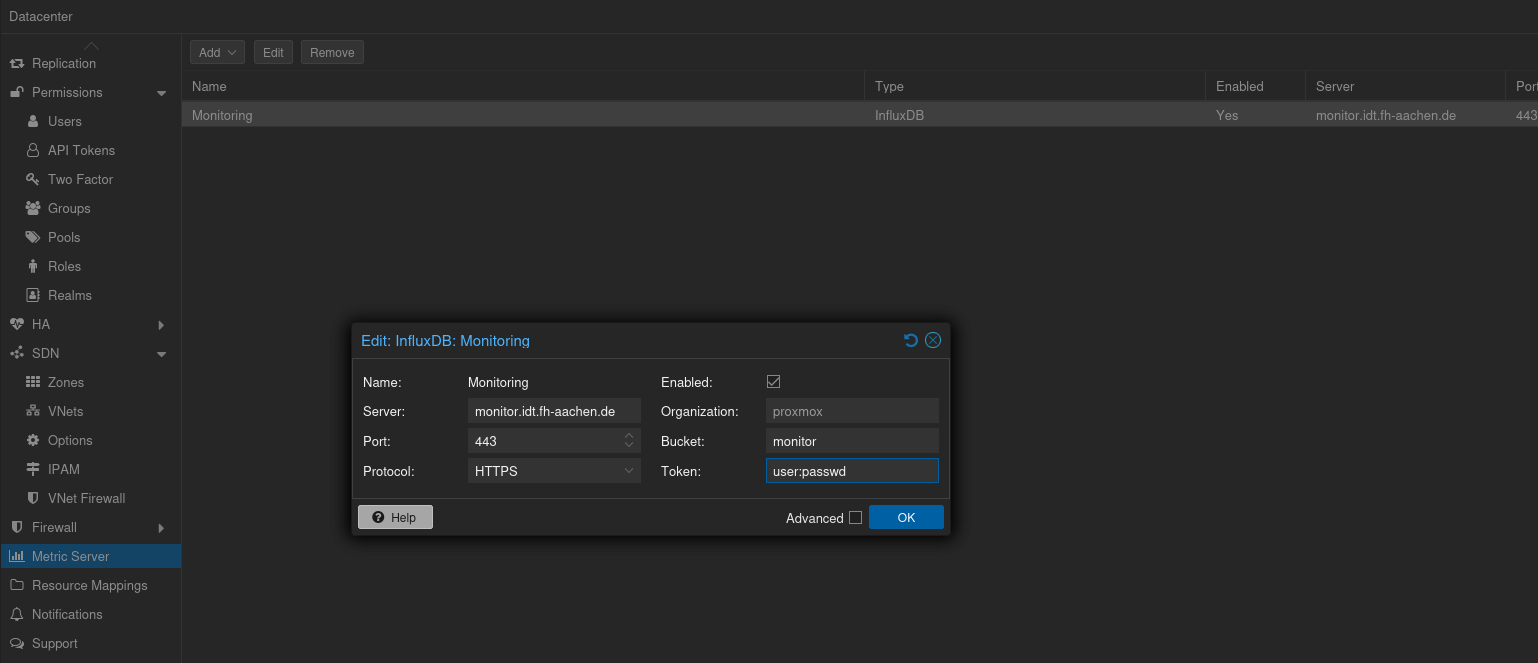
Proxmox settings of the metric server. This has to be configured on the datacenter settings.
For the user and password, we can combine the two and use it as token - as typical for the v2 mode on a InfluxDB 1.8 server, as noted in the Proxmox docs as well:
In the v2 compatible API of 1.8.x, you can use user:password as token (if required), and can omit the organization since that has no meaning in InfluxDB 1.x.
In Grafana, we add the dashboard of https://grafana.com/grafana/dashboards/10048-proxmox/ to get things going and adjust as required.
Ceph Integration
For Ceph, we need to add a separate database in our InfluxDB server.
And on all Proxmox hosts we need to first install the python3-influxdb package which is required for the influx module:
apt install python3-influxdb
and then enabled the influx module on one of the hypervisors
ceph mgr module enable influx
If this does not work - one should restart the active monitor and try again.
Next, we create a new database in our InfluxDB and grant read privileges to the readonly user for grafana:
source .env
docker compose exec influxdb influx -username telegraf -password $INFLUXDB_PASSWORD -execute 'CREATE DATABASE ceph'
docker compose exec influxdb influx -username telegraf -password $INFLUXDB_PASSWORD -execute 'GRANT read on "ceph" to "monitor"'
Then after restarting the active monitor to have the module enabled, we can set the configuration of our InfluxDB host:
ceph influx config-set hostname $hostname
ceph influx config-set port 443
ceph influx config-set ssl true
ceph influx config-set database ceph
ceph influx config-set username telegraf
ceph influx config-set password $INFLUX_USER_PASSWORD
We require another restart of the monitor once we have this set, as the SSL lib seems to be only loaded on demand when this is set and is not respected otherwise.
Then, we can add a new datasource for the ceph database in grafana and start visualizing the Ceph information. A good start should be this dashboard: https://grafana.com/grafana/dashboards/23343
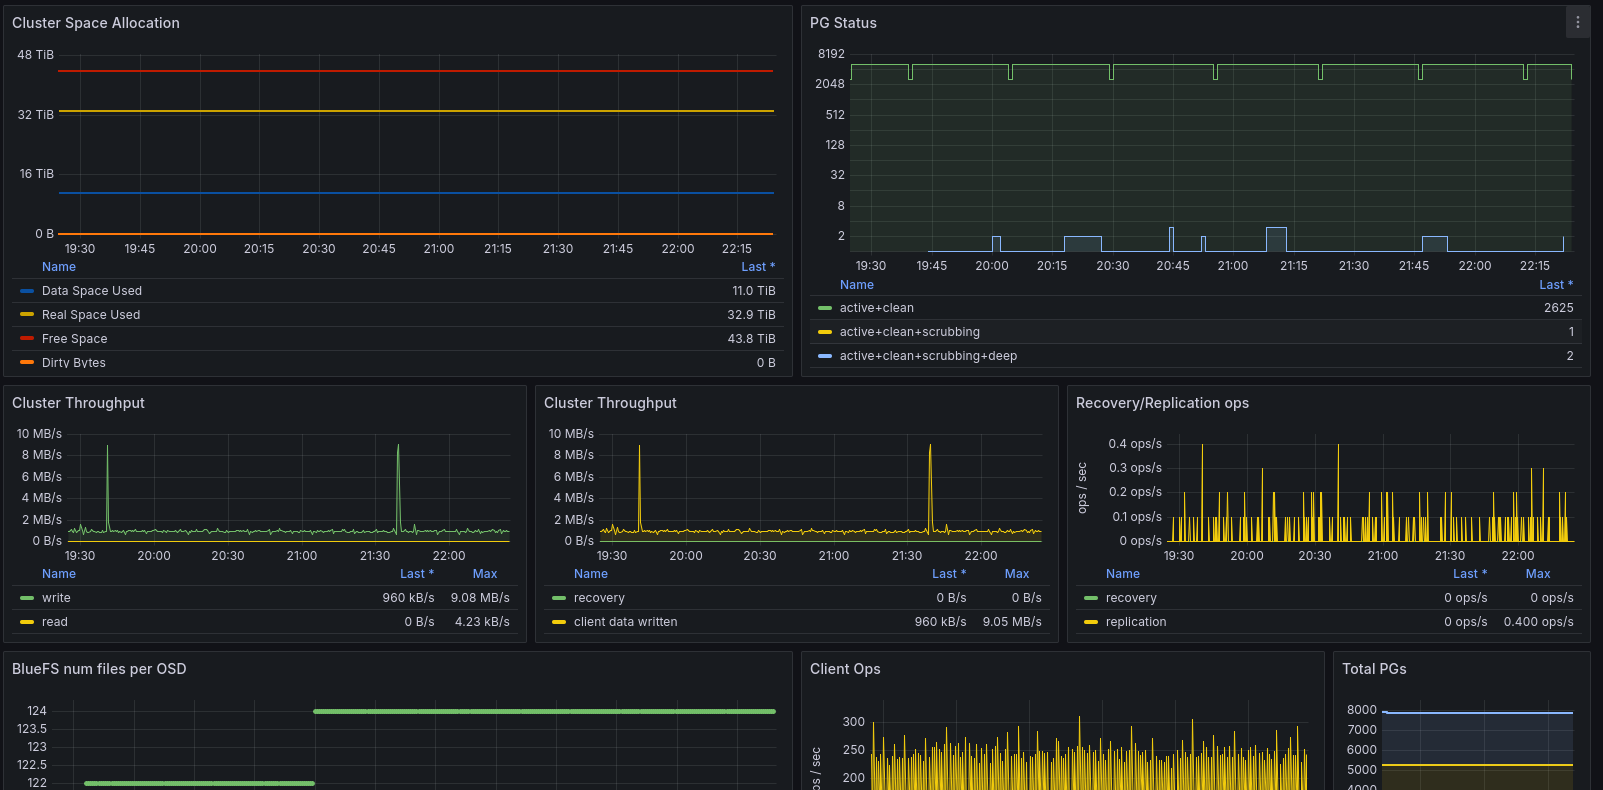
Ceph Dashboard on Grafana.
Alternatives
The alternative to this would be to use telegraf on one of the hosts, as it includes a ceph inputs plugin: https://github.com/influxdata/telegraf/blob/master/plugins/inputs/ceph/README.md However, this requires to have one host up all the time for telegraf, while the influx module is high-available through the managers. Of course, this is the case for the monitoring VM anyway, which is why this VM should be HA enabled as well.
One problem of the solution is, that it does not provide health status and information about how many OSDs are in or out, as this is only available in the Ceph dashboard. So this would be a reason to also set up the telegraf provider or use something like checkmk as described in the Thomas-Krenn-Wiki.