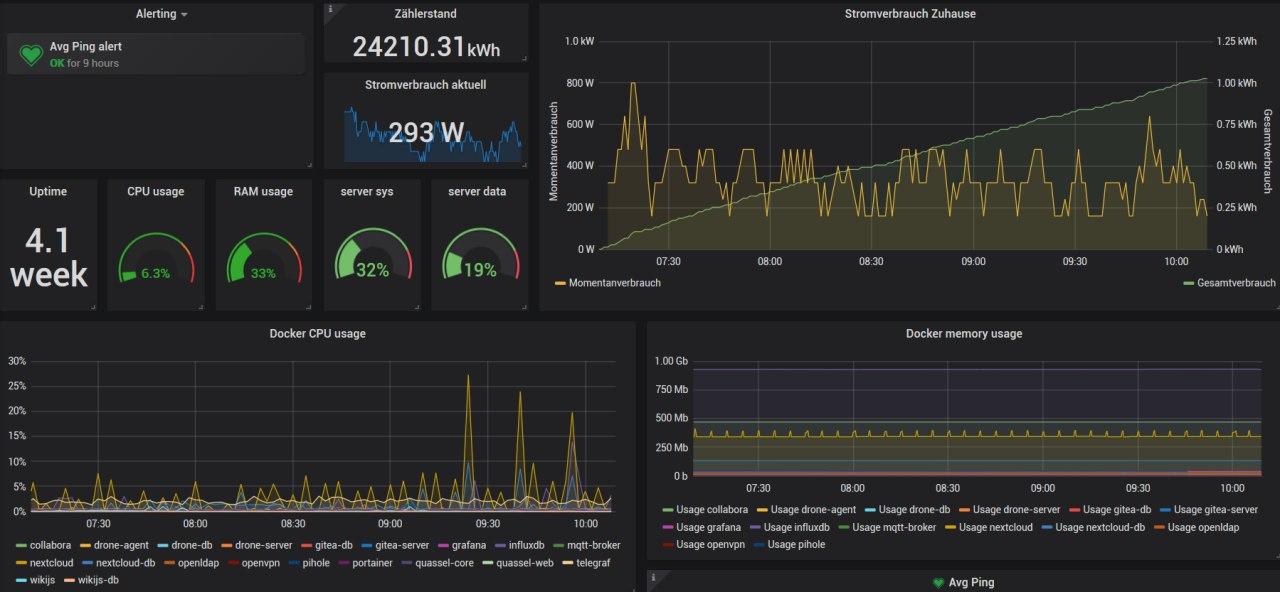
Grafana monitoring
Like I mentioned in a previous blog entry I made the switch from the whole TICK stack to TI+Grafana, which I want to talk about a bit in this entry.
On the long run I want to embed the Monitoring into some kind of managing terminal like OpenHAB or home-assistant.io (preferably the latter) where I can configure switches with Tasmota and see the current state of my Home-Automation.
But like all good things this is going to take a while as I am not full-time working on my home automation. In my free time I just document my progress and try a lot of new tech related things. Actually the documentation is often far behind my current projects and in my head I am already three steps further. Regarding my home automation I already implemented my smartmeter which I want to talk about in a separate post. So this post is already a few months behind which makes it already a little harder to memorize what went wrong during my setup.
Grafana is a very mature visualization software which has a lot of features and is not limited to InfluxDB (so one day I will probably test Prometheus or Graphite). It has support for LDAP, embedded links and holds many features to visualize metric data. It just felt a lot more comfortable than Chronograf as it already is older and a complete software on its own.
There were already examples for the dashboards, which you can copy from a global provider with generic variables for the docker-telegraf-input which is very nice.
From there you can copy the columns you would like to see on your own dashboard and get something looking like this:

Grafana also brings monitoring features which can be helpful to monitor the uptime or resource usage of the server.
So far everything works very smooth and stable.
I made the dashboard public accessible so everyone on my local network could see it but can not manipulate it. This is quite safe as it is not globally available on the internet.